Slicing Charts
|
|
Check the pivotable check button of the chart wizard to activate it. |
|
|
|
|
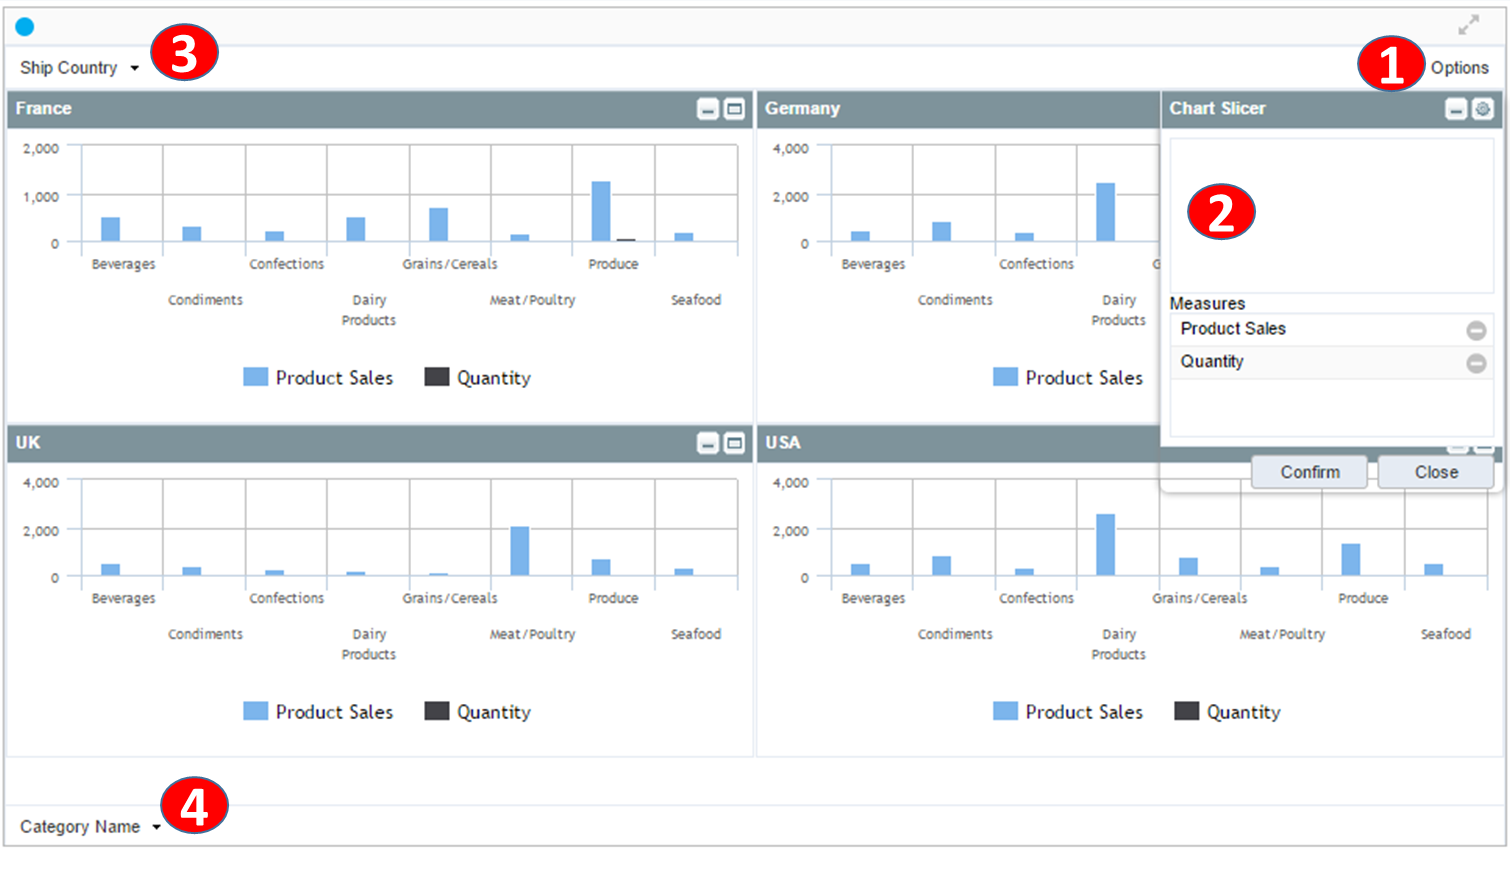
1 |
Represents a list of dimensions and measures defined in the report pivot. |
|
2 |
Meager area: Add a message to be expressed by the value of the chart. |
|
3 |
Slicing Dimension Area: Drag and drop the dimension item to divide the chart. Example: If you add a country dimension, the chart will be displayed by USA, Canada, Mexico. |
|
4 |
X-axis dimension area: Add dimension item to be set to X-axis. |
|
|
Reflect the changed slice pivot settings and run the report again. |