Embedded with D3JS visualization and supports most creative data visualization and analysis charts with easy wizard based configuration.
Package included data visualization charts are as follows:
|
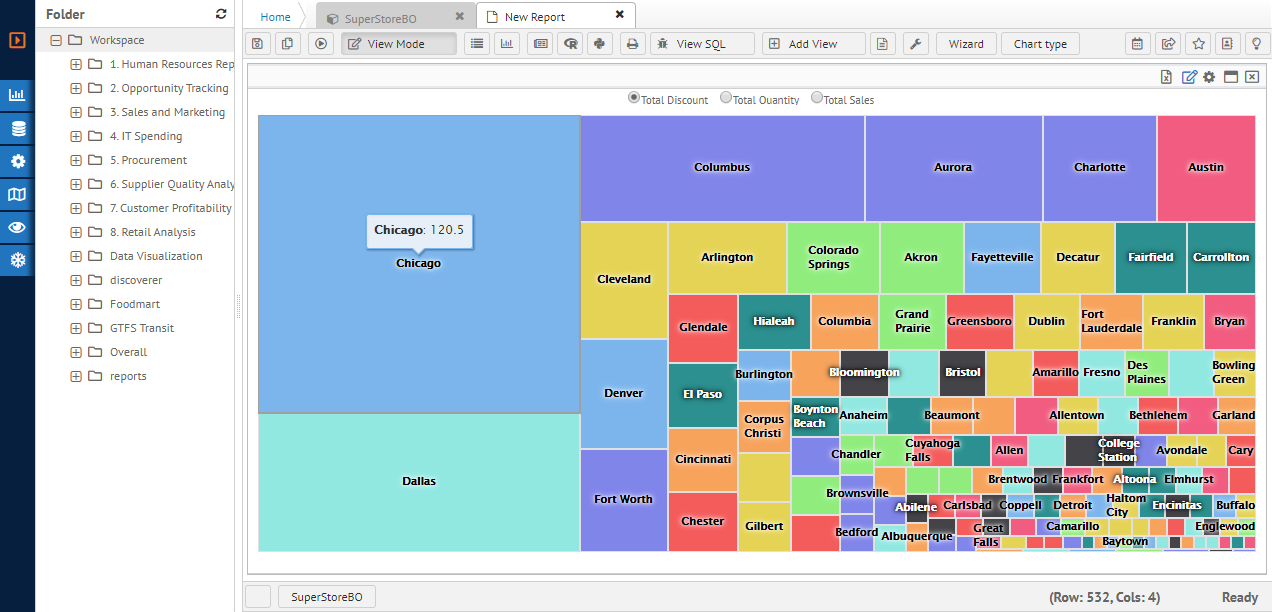
TreeMap |
|
|
|
|
|
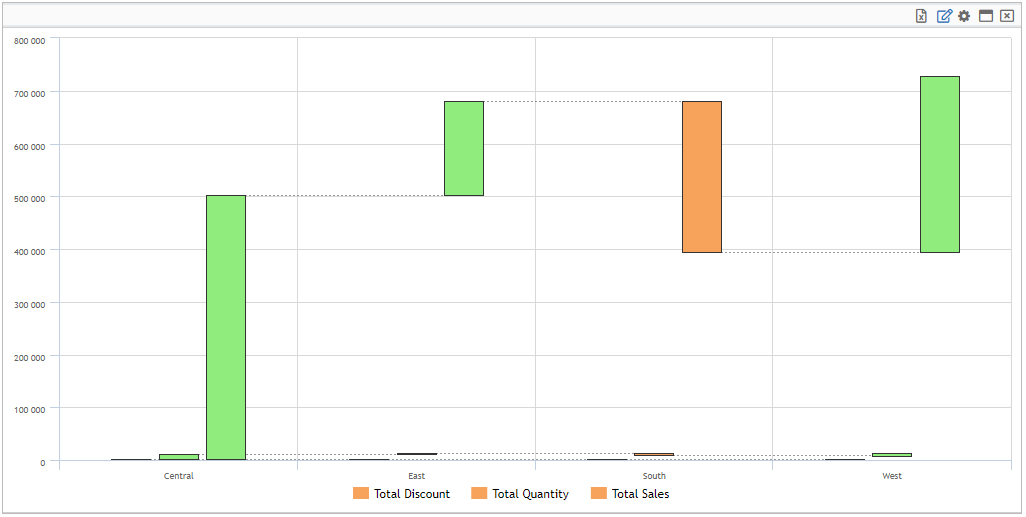
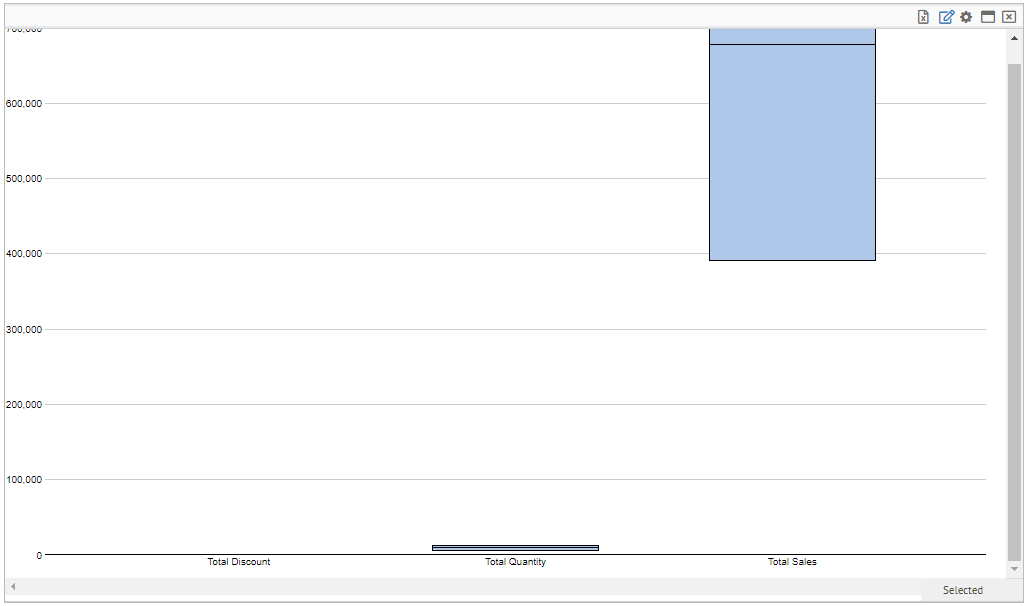
Waterfall |
|
|
|
|
|
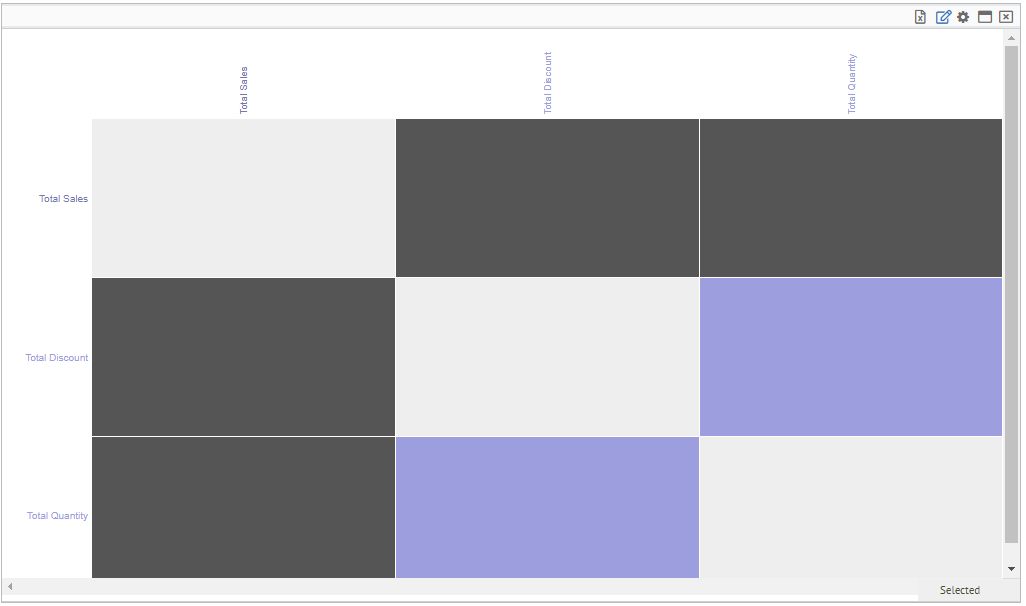
Comparison Matrix |
|
|
|
|
|
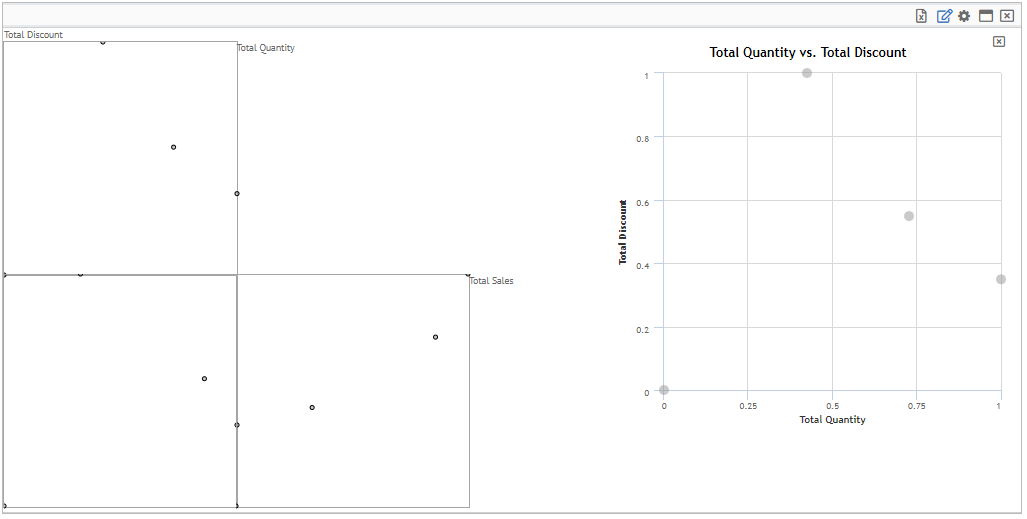
Parallel |
|
|
|
|
|
Mean and Deviation |
|
|
|
|
|
Box plot |
|
|
|
|
|
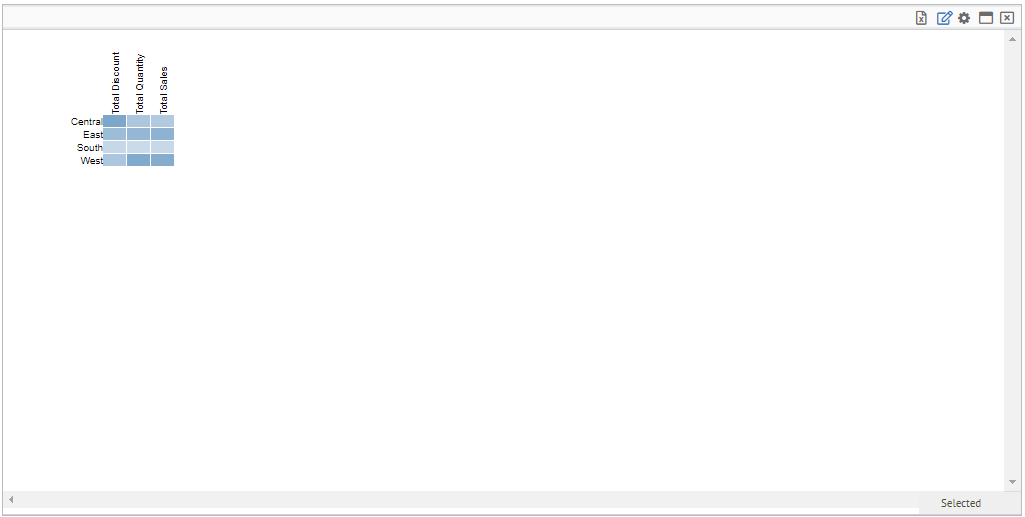
Matrix Diagram |
|
|
|
|
|
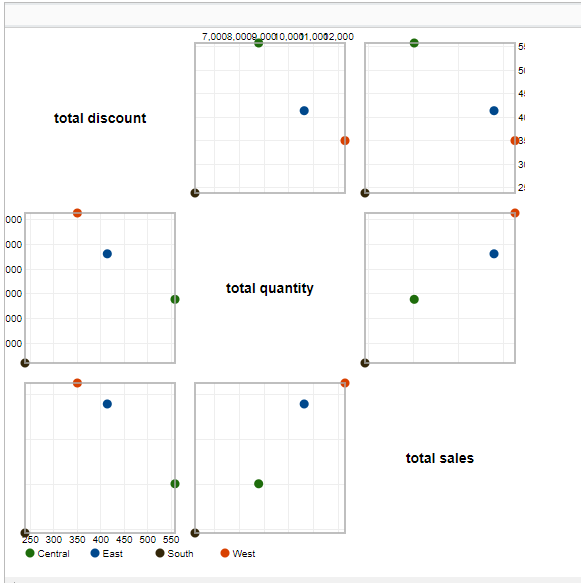
Clustering |
|
|
|
|
|
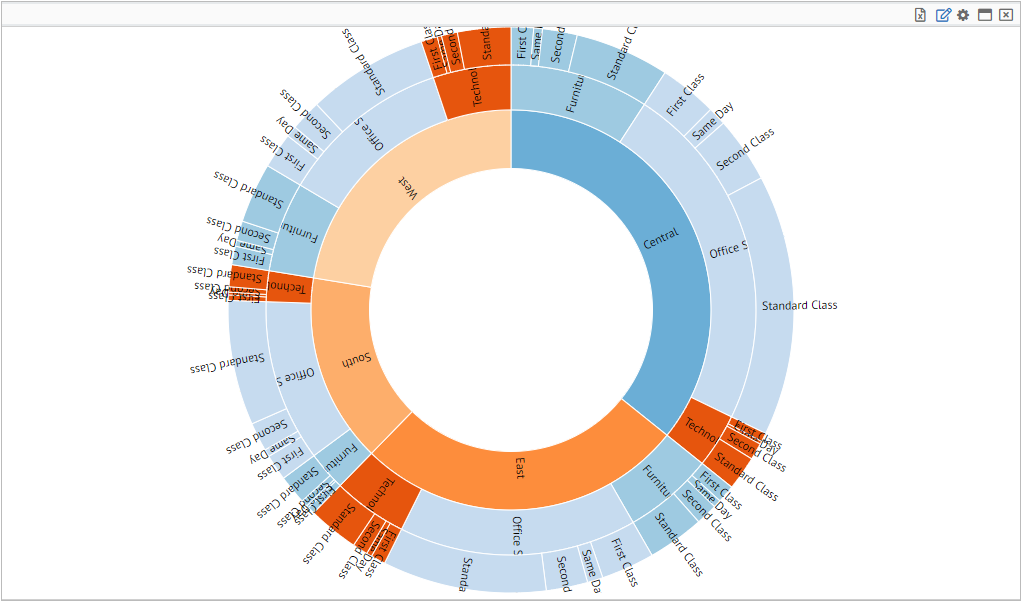
Sunburst |
|
|
|
|
|
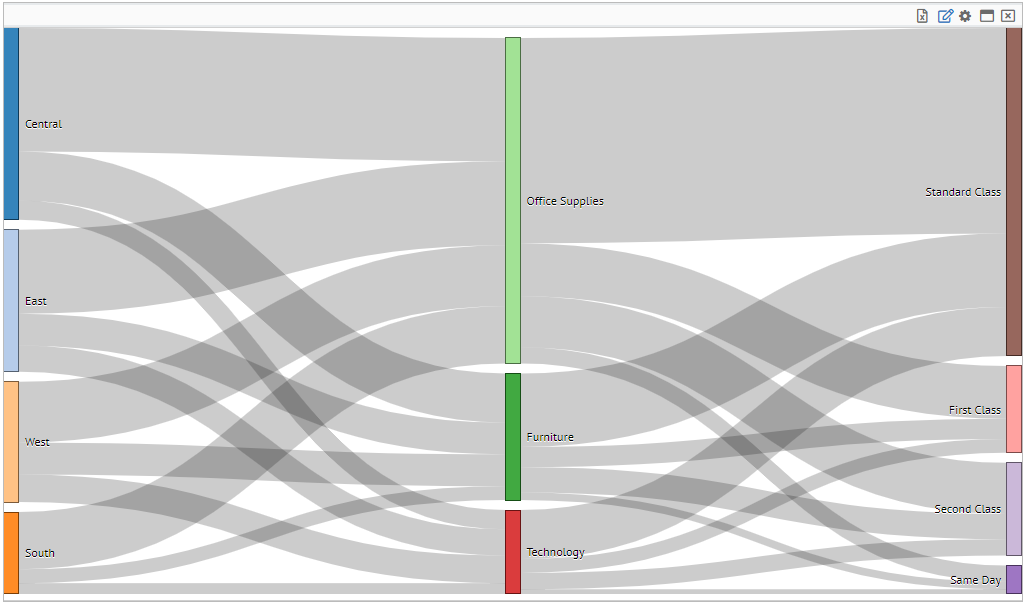
Sankey |
|
|
|
|
|
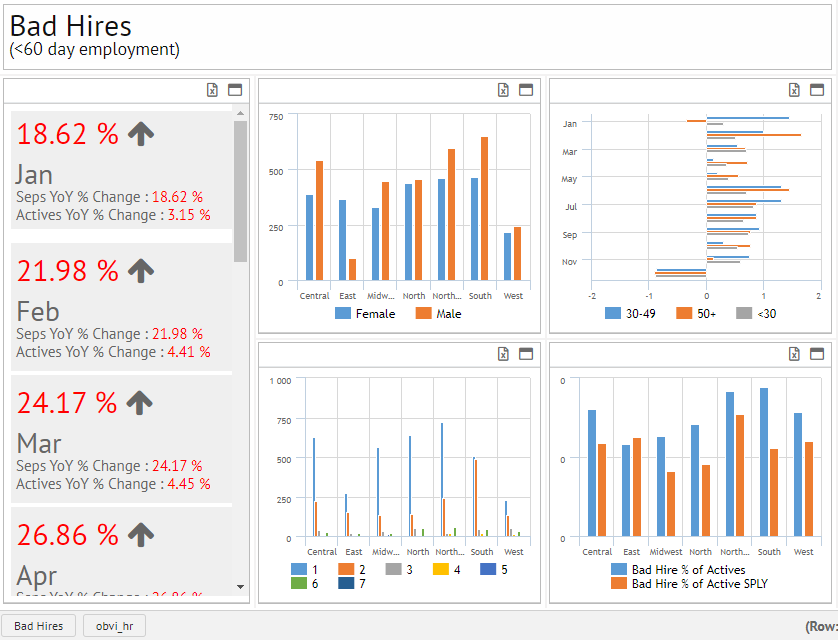
KPI Indicators |
|
|
|
|

To add more chart types and directly bind report results without programming effort, also provides developer API. One-time development of API and user can generate endless of data visualization with different view angle and business requirements.