How to make a pivot table with variations
Pivot table is a fundamental element for all business reports. Data visualization to grep basic understanding starts from here. The variation of the pivot table is very versatile and with changing small configuration, you can get more valuable results for your business purposes.
There are many commercial business reporting solutions in market with representing data visualization. But most of these tools are very poor on basic pivot table functionality to fulfill business requirements.
This pivot table is done on http://www.amplixbi.com data visualization software on the cloud. You can get free cloud service with your business email on the fly.
Terms used and basics of pivot table structure are as follows:
- Measure: Quantitative values such as Sales amount or order counts
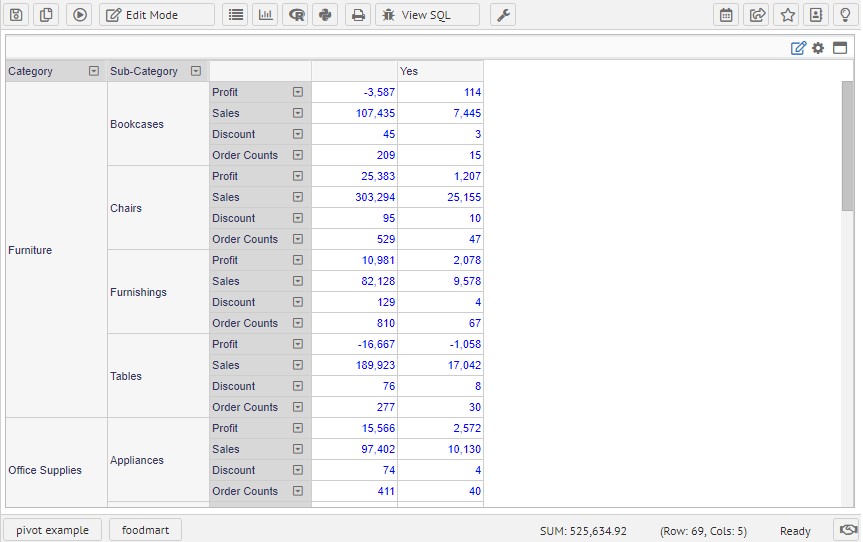
- Row Dimension: Category and Sub-Category to display on right side grouping
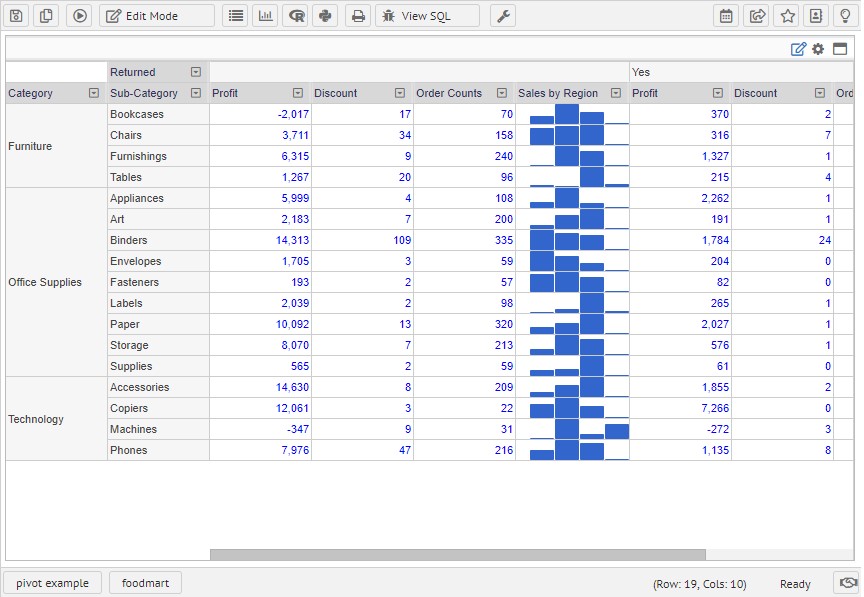
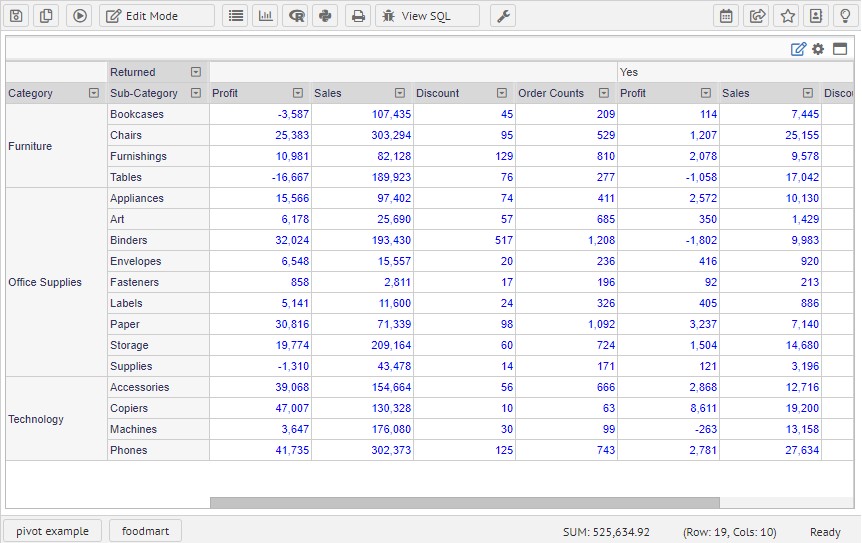
- Column Dimension: Table header dimension which is Returned
- Data area: Data value area which shows numeric data value or microcell chart
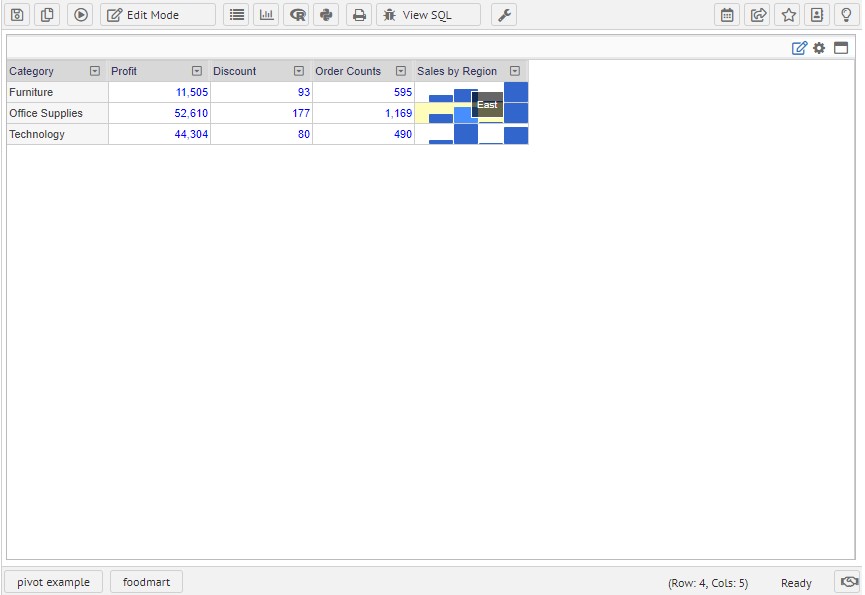
- Micro chart for row-level data visualization: Sales by Region
- Clustering: Dividing dimension for each report area
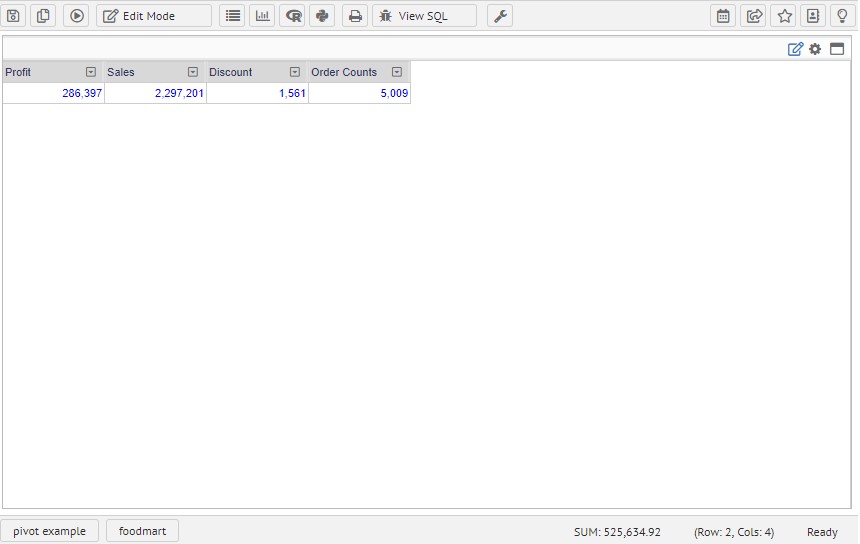
Simple types
Using only measures values on your report, you can get quick understanding of your data. This type of grid results are useful to apply KPI(Key Performance Indicator) widget with gauge control or business indication values.
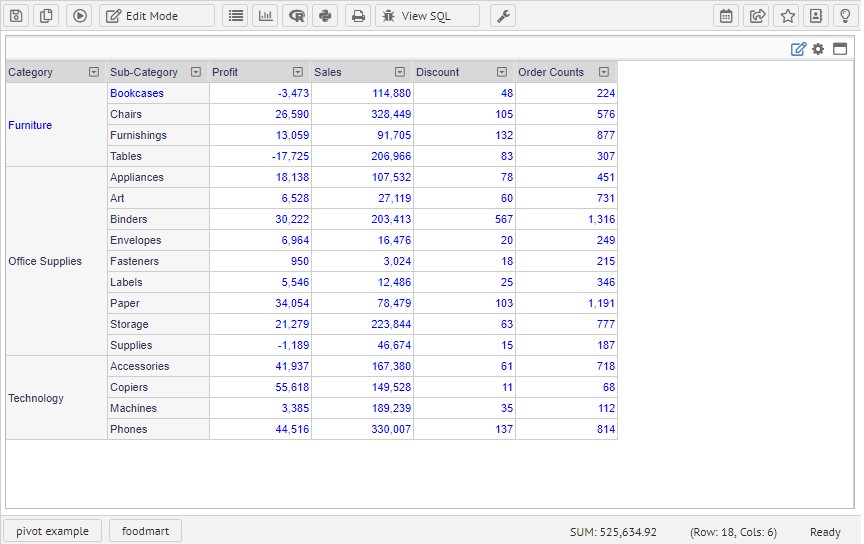
Measure with row dimensions.
On this example added Category and Sub Category on row dimension area. With this table results, it is easy to understand which item has more sales with subcategories.
Column Dimension to separate view of detail
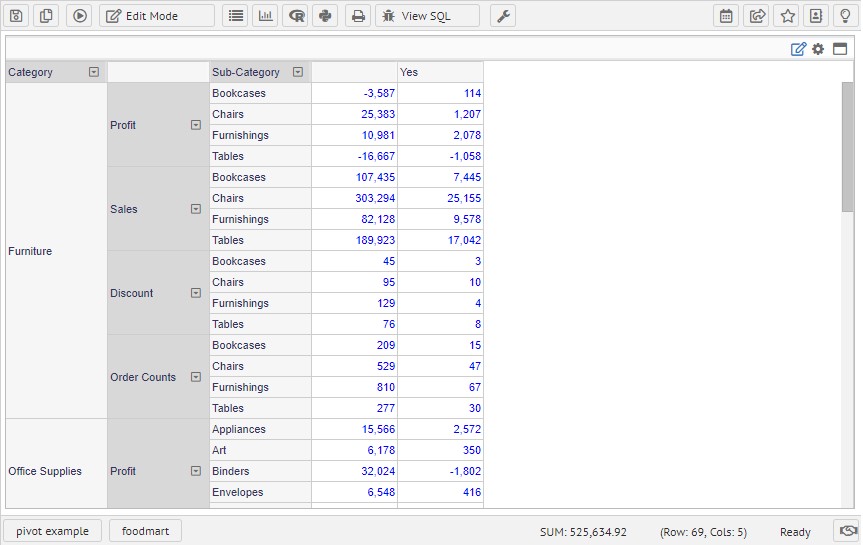
Moving measure location on row/column
Moving measure location makes your table view simplified and good for easy horizontal comparison. This will group every category information in vertical and increase the readability of table results.
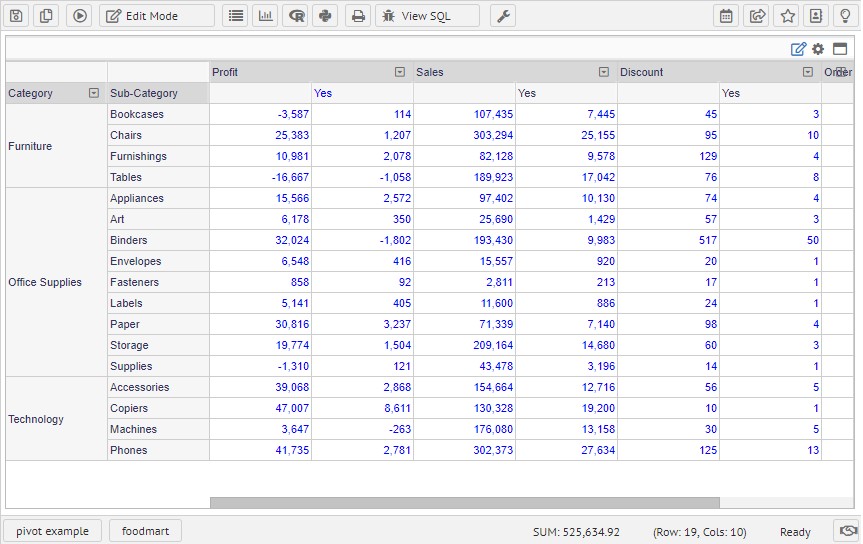
Changing measure depth
Changing measure to step up to grouped values. This will much simplify your comparison with multiple sub-items with a simplified result view. In this view, you can group Profit, Sales, Discount and Order Counts in a group so that reducing the complexity of different values mixed in data area.
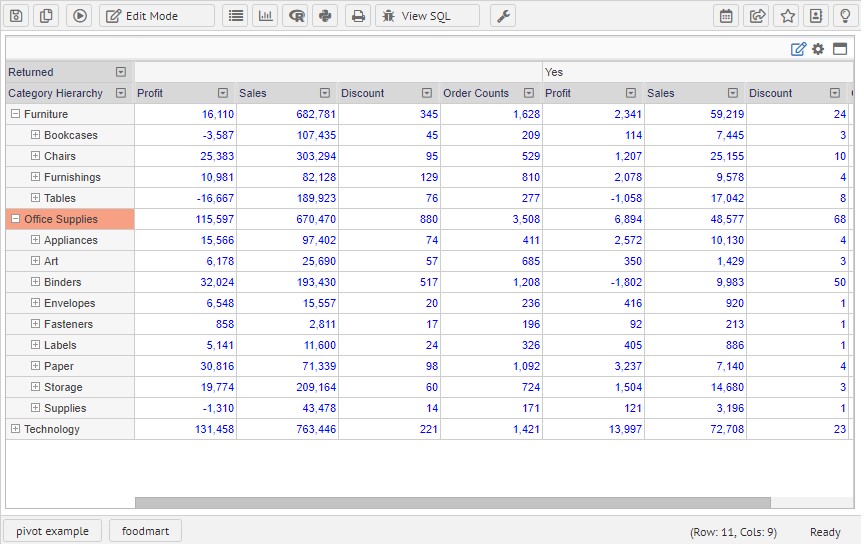
Moving measure depth on the column side
Similarly measure index can be moved up or down on a pivot area. By arranging measure categories on top or middle of column area, you can get categorized results shown below. It is much easier to compare each measure Ordered values with Returned items
Make tree hierarchy to data
Hierarchical access on the data gives you the accessibility of data from top to bottom. For example, you can start with Year and get through to Quarter and Month for more details. The navigation for hierarchical data is much like browsing through the folder. This could be useful to get data from Category, Sub categories to products to get data information. For the performance on client browser or software and data validation, the hierarchy request for the next step needs to executed separately.
A micro chart on grid cell
Micro chart is inline cell charts on the grid. The chart maximum / minimum value needs to be consistent for all of the row. If your chart on Furniture’s maximum height of sales is 10000 and Office Supplies for 100 and the bar size is same then this chart gives more misreading to end-users.
Formulas to value up your data.
Using simple formula, you can get more valued results from result view. More detailed formula information will be continued on the next article. The formula will be included with the following functions.
- Subtotal and Grand total
- Average, Minimum, Maximum
- Percent of total
- Cumulative Percentage
- Incremental values
- Difference
- Ranking
- Standard Deviation and Standard Deviation P
- Percentile, Percentile Excel
Further steps and the next article
On the next article, I will introduce self-service dashboard development and make interaction in detail. This example in this article is done on http://www.amplixbi.com data visualization software on the cloud. You can get free cloud service with your business email on the fly.
Enjoy!
